Guide
How to design an admin dashboard in React and Figma
Last updated 6 November 2026
An admin dashboard is less one screen than a frame that every other screen lives in. Below is how to lay out that frame, what belongs on the first screen, and how lists and settings pages fit in. It comes from building nine full example screens out of Tessera, including the things that did not fit the first time.
The short answer
To design an admin dashboard, start with the frame: a side navigation for the main sections, a page title with the actions for that page, and a content area that takes panels of different widths. The first screen shows three or four key figures, one trend and one list of what needs attention. Lists get a filter row and actions for selected rows. Settings get a two-column form with one save button. Then build every block from the same tokens, so a change in colour, density or theme reaches all of them.
The frame every screen lives in
People spend hours a day in an admin tool, and they move between the same five or six places. The frame should make those places easy to reach and stay out of the way.
- A side navigation for the main sections. In Tessera it is 250 px wide, and it collapses to a 56 px rail of icons with tooltips. The collapse button stays in the same place in both widths, so it never jumps away from the pointer.
- Group the items, with a line between groups, and put settings and help at the bottom, above the signed-in person.
- Make the person’s row a button that opens an account menu: name and email first, then profile, billing and log out.
- Use a top navigation instead when the product has few sections, or keep the brand and the search in the top bar and leave them out of the side navigation. Never both in both places.
- Under the frame, every page starts the same way: the page title, one line of context and the actions for that page on the right.
For a screen reader, the side navigation is a nav landmark named Main, and the current page carries aria-current="page". That is how someone who cannot see the highlight still knows where they are.
What belongs on the first screen
The first screen answers one question: is today a normal day? A finance lead should be able to answer it without scrolling.
- Three or four key figures in a row, each with a short label.
- One trend over time, such as revenue against expenses, as a chart. A trend is a chart, not a figure.
- One list of what needs action: the latest invoices, the open approvals, the failed payments.
- What the team did, as a short activity feed, if people work on the same records.
- A period switch, such as 30 days, quarter and 12 months, that changes every block at once.
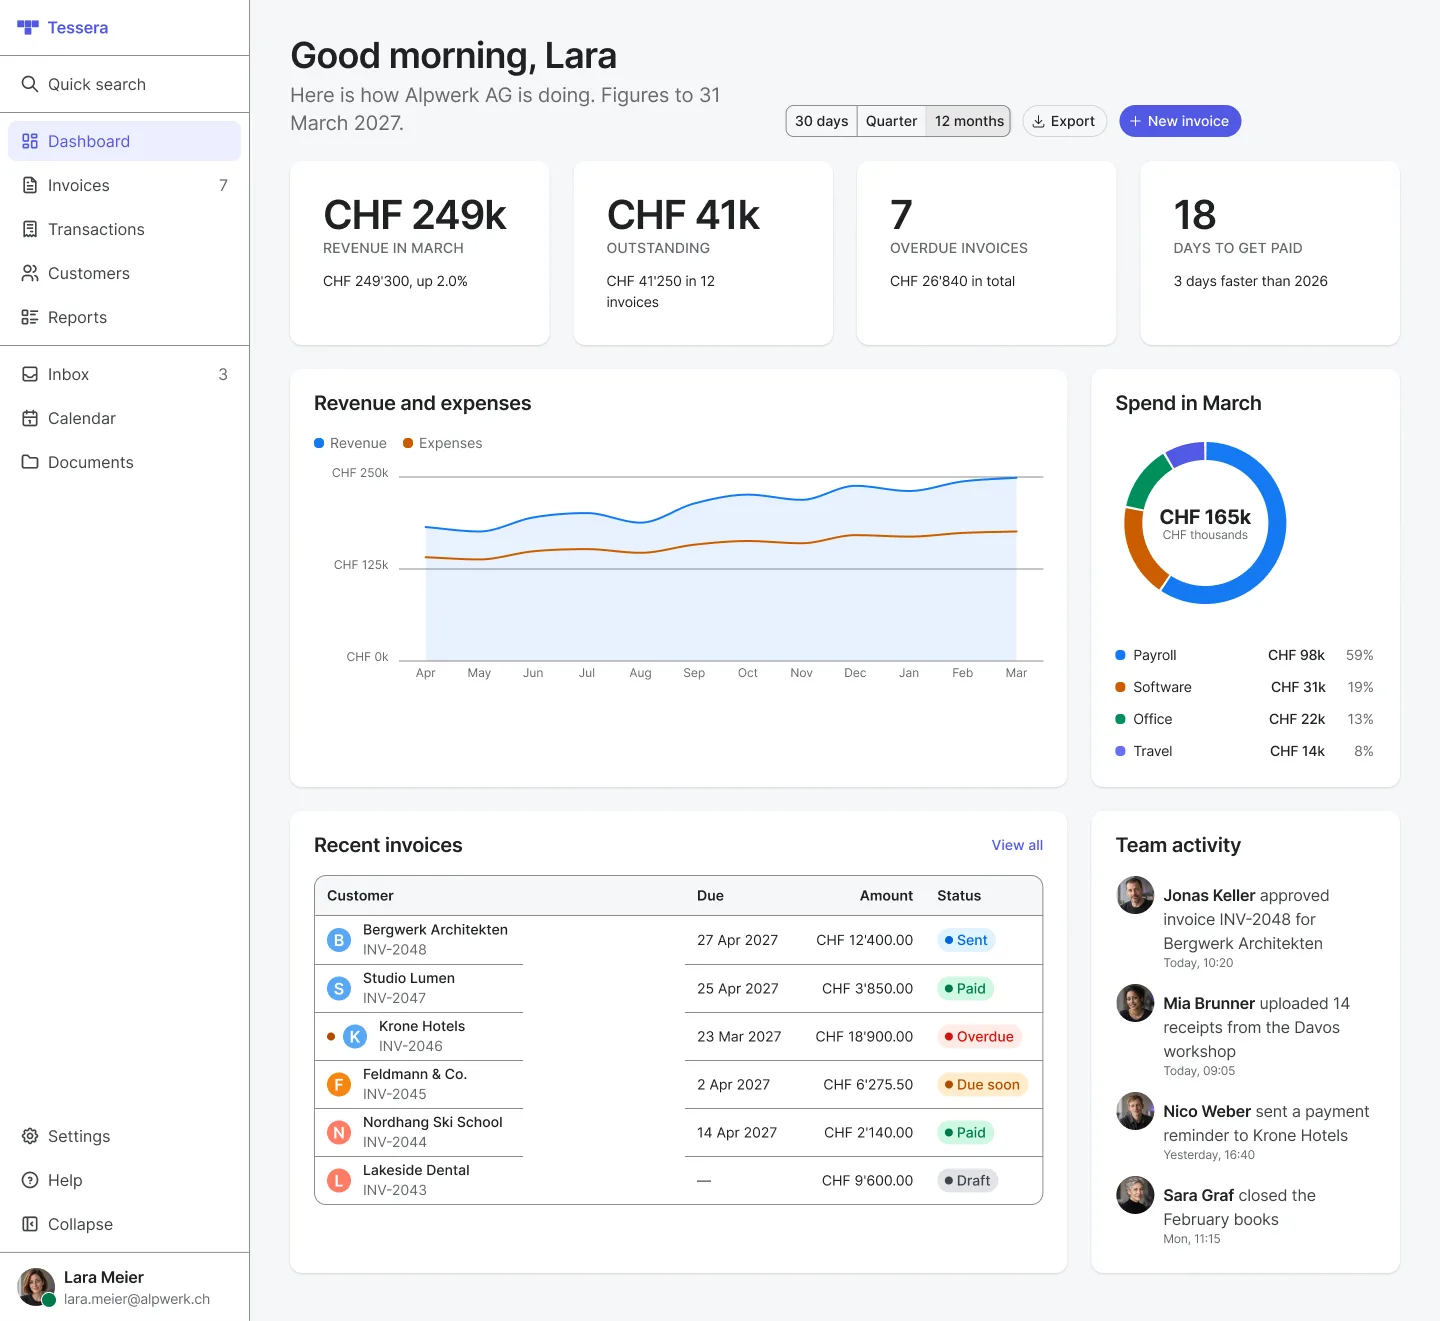
Our finance dashboard example uses exactly that: SideNavigation, StatCard, Chart, Table, Badge, Feed and a SegmentedControl for the period. How to build the ledger and the figures in detail is in the invoice ledger guide.
Density: what did not fit the first time
A dashboard is a grid of narrow panels, and narrow is where components break. Building our finance dashboard at a 1280 px wide window showed three problems.
- A large figure did not fit a quarter-width card. “CHF 249’300” overflowed it, so the example shows “CHF 249k”. A dashboard needs a smaller, denser figure than a marketing page does.
- Five table columns did not fit a two-thirds column, about 570 px wide, and the table scrolled sideways. We cut it to four. Plan the columns for the panel, not for the full window.
- The chart’s axis labels had a fixed 40 px gutter, and “CHF 250k” spilled 26 px past the panel edge. The gutter now measures its widest label.
The lesson is simple: test every block at the width it will really get, with real amounts in your real currency. A block that looks fine on its own can fail as a quarter of a row.
Lists, filters and bulk actions
Most admin work happens in lists: transactions, clients, policies, users. Our transactions example shows the parts.
- Tabs for saved views with a count, such as All, Money in, Money out and Needs review. Tessera’s Tabs come in line, pill and folder styles, in a medium and a small size.
- One filter row: a search field, a filter or two and chips for quick filters such as Missing receipt, with one way to clear them all. Keep every control in that row the same height. A multi-select that grew taller with each chip broke our row, so the example uses a small single select.
- When rows are selected, show how many and the actions for them. The header checkbox shows a mixed state when only some rows are selected.
- Sorting and pages at the bottom. Keep the first column fixed, so the row stays recognisable when the table scrolls.
- Use the small status badge in tables. The large one is heavier than the text around it.
Settings pages
Settings pages work best in two columns: what a section is about on the left, its fields on the right, a line between sections and one save button at the end. People read the left side to find their place and the right side to act.
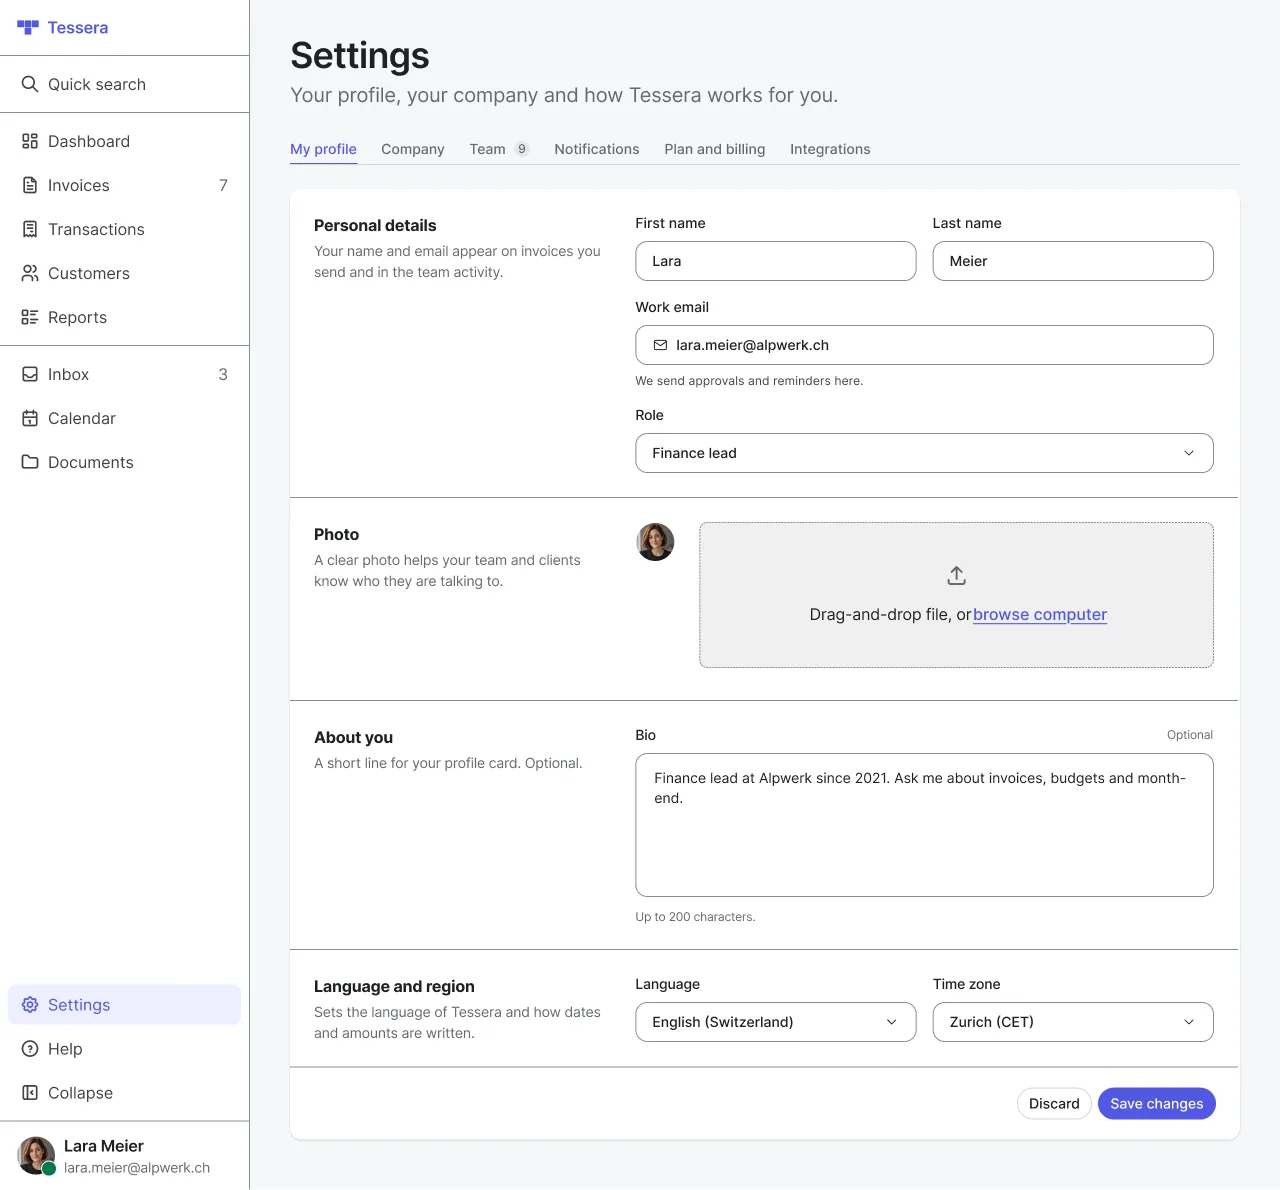
- Use tabs across the top for the areas: profile, team, billing, integrations.
- Give every field a visible label. In Tessera, Input, SingleSelectDropdown and TextArea share the same label, height and spacing, so two fields in one row line up without extra work.
- Show connected services as tiles, each with its own switch and a status when something needs attention. A switch with no visible label needs an aria-label, because the tile title is not its label.
Light, dark and your brand
People who spend a working day in a tool often want it dark. Plan both themes from the start, because a colour picked for white often fails on dark grey. In Tessera every colour is a token with a light and a dark value, and text keeps at least 4.5:1 contrast in both. The brand colour is one choice, so a client’s colour reaches every button, link and selected item at once. You can try both on real components in the Playground.
What Tessera has for this, and what it does not
It has 62 documented React components with the same names in Figma, and nine full example screens built only from them: a finance dashboard, a transactions ledger, two settings pages, sign in, an inbox, a profile and two marketing sections. You can open them in the docs, for example the finance dashboard and the transactions ledger.
It does not have every block a dashboard needs. A page header, a panel with a title row, a filter row, a bar for bulk actions and a settings section with a title beside its fields are not components yet. The examples build them from smaller parts, and the docs mark them as such. StatCard is a large figure, and there is no compact version for dense rows.
If an AI agent writes some of your screens, read how to make Claude and Cursor use your design system. If you are still choosing between your own system and a ready one, read build or buy a design system. To see the components and prices, start with the Playground and the pricing.